Recently G0MQW has been looking at some meteor reflections from the Dourbes Belgium BRAMS transmitter 49.97MHz and found some superb correlation between not only meteor pings on UK 10m QRSS beacons, but also, mini openings on 10m lasting a few minutes, maybe he will write this up. The messages and Captures on the subject will be found in the qrssknights group archive on groups io.
These tests raised a little interest in meteor reflections on qrss knights group. I have been busy outside the shack since my return to the UK in October, I had an urge to take a look at the Leonids showers but resisted the temptation until the weather got too cold for outside stuff. The tests were then enough to get the radios running at G3ZJO.
A question was asked re one capture which showed C shaped traces which resemble the Purlicue shape. Purlicue ? those with a good memory may have noted the name which was the subject of a question on Egg Heads BBC2 TV just yesterday. Non Egg Head fans use Google. I didn’t know it had a name until yesterday. They have previously been named ‘epsilon’ shapes which is often descriptive of them. While we are at it, who says they are C and epsilon shape ? The observed shapes are the result of the convention we use to observe them, with a horizontal Time scale and vertical Frequency scale. View them with horizontal Frequency scale and vertical Time and they become U and W shapes.
The question was :-
Who knows how this happens ?
I replied :- Yes who could ever explain exactly what is going on … I like to listen to the audio and watch the display being built up in 3D.
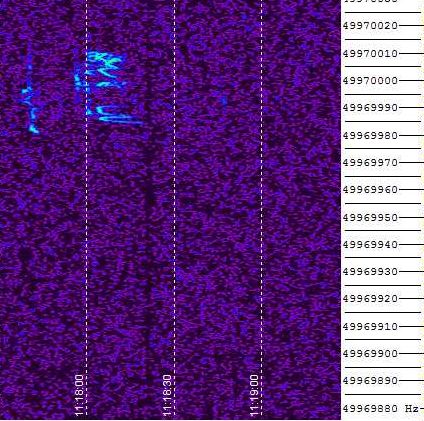
Today I captured a nice ‘epsilon’ like display on 49.97MHz, not too strong a signal but fine for examining and thinking about what are the possibilities for the cause of the effect. So first let us take a look at my 3 Captures of the same event.
First a fairly fast scroll capture.
Next a slow scroll.
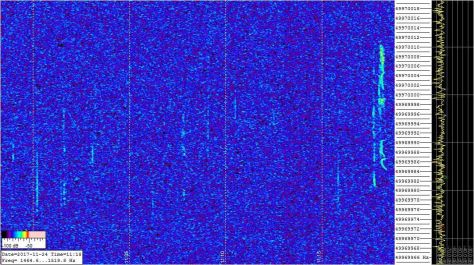
The signal was not strong enough to produce much colour on the peaks but some yellow spots can be seen, this indicates that this trace is over dense and we are looking at the plasma tube of the trail.
The capture also shows several other meteor trails, there were many this morning all receding rather than approaching BRAMS, I calculated the speeds of a couple and they were at terminal velocity.
Next Capture is in 3D.
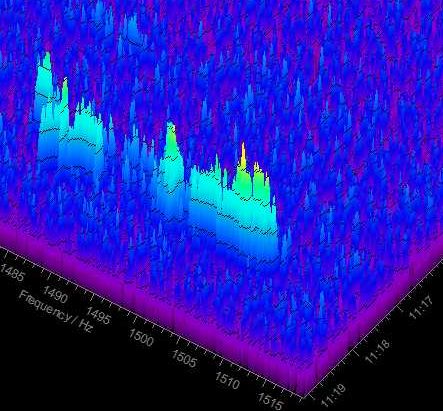
This capture scrolls in time, into the past, from bottom left to top right. The high end of the frequency scale is in the bottom right which corresponds to the top right of the 2D displays. Scrolling right like this allows us to peer into the Purlicules at 1486Hz and 1483Hz on the frequency scale. There is no doubt about their smooth curved shape like architectural alcoves or an amphitheatre or even an audio radar reflector wall used to detect the sound of approaching aircraft in WWII.
I drew some sketches of a meteorite passing in the atmosphere over Dourbes with a long plasma tube expanding and dispersing as time goes by. I also plotted spot locations on the time axis of the two C shapes which make an ‘epsilon’, the top stroke of the highest frequency C appears to be drifting slowly HF the bottom stroke slowly LF, likewise the top of the lower C shows +ve Doppler and the bottom stroke -ve Doppler, (LF) all at same time. I calculated that the complete two C’s ‘epsilon’ shape was moving LF at 161 km h. This measurement is liable to some variations due to the use of bi static radar but it is useful to place object reflections in the right ball park. There are five different Doppler shifts taking place at the same time.
It is often conjectured that these curves are produced by wind shear, I could never understand how the graphic representations shown, or the idea of thinking of shining a torch at a broken mirror could produce elegant curves, hence my 3D captures, sketches and plots today.
Surely the walls of the plasma tube I had sketched would be a prime suspect for the phenomena, bent by wind shear would they reflect and display as C and ‘epsilon’ shapes.
Edit 21 December 2017
The full explanation of just how C and ‘epsilon’ shapes are formed still eluded me and I decided to contact Peter Matinez G3PLX. I was aware that he produced a meteor Doppler simulator, actually in the 1980’s, he modified it for my use to reproduce Doppler from helicopter blades more recently. Unfortunately his Meteor simulator was lost on an old DOS computer he explained, however he outlined that he uses a single line point reflector method to model trails and he had an idea for a new simulator, soon this was in my hands.
Can we produce a C or U shape (they are the same, it depends how you view them) reflection using a mathematical simulation.
Below. A U or C shape generated by the G3PLX meteor ping simulator displayed by Spectrumlab using typical meteor capture settings.

Below. The simulator is set to start with a slightly off vertical trace. The output is a 1500Hz tone and the trace representing the meteor trail. The Meteor Radar transmitter and the Receiver are to the right of the simulator, no signal is reflected due to the tilt.

Below. When the trace is vertical the signal is reflected.

Below. The bending of the trail by a wind shear layer is sinusoidal pushing the top of the trail to the right +ve Doppler, the bottom to the left -ve Doppler, the centre remains stationary. As the trail rotates, the centre passes through vertical then two reflecting regions one above and one below develop and reflect the signal.

Below. Can we now simulate a W or ‘epsilon’ shape. All we need is to add 3rd harmonic sine shape to the curve.

Below. The simulator set to introduce a 3rd-order curve, W / ‘epsilon’ output displayed by SpectrumLab.

Below. ‘epsilon’ and C curves displayed one after the other by SBSpectrum.

Many thanks to Peter Martinez G3PLX for sharing his knowledge and skills on this subject.
